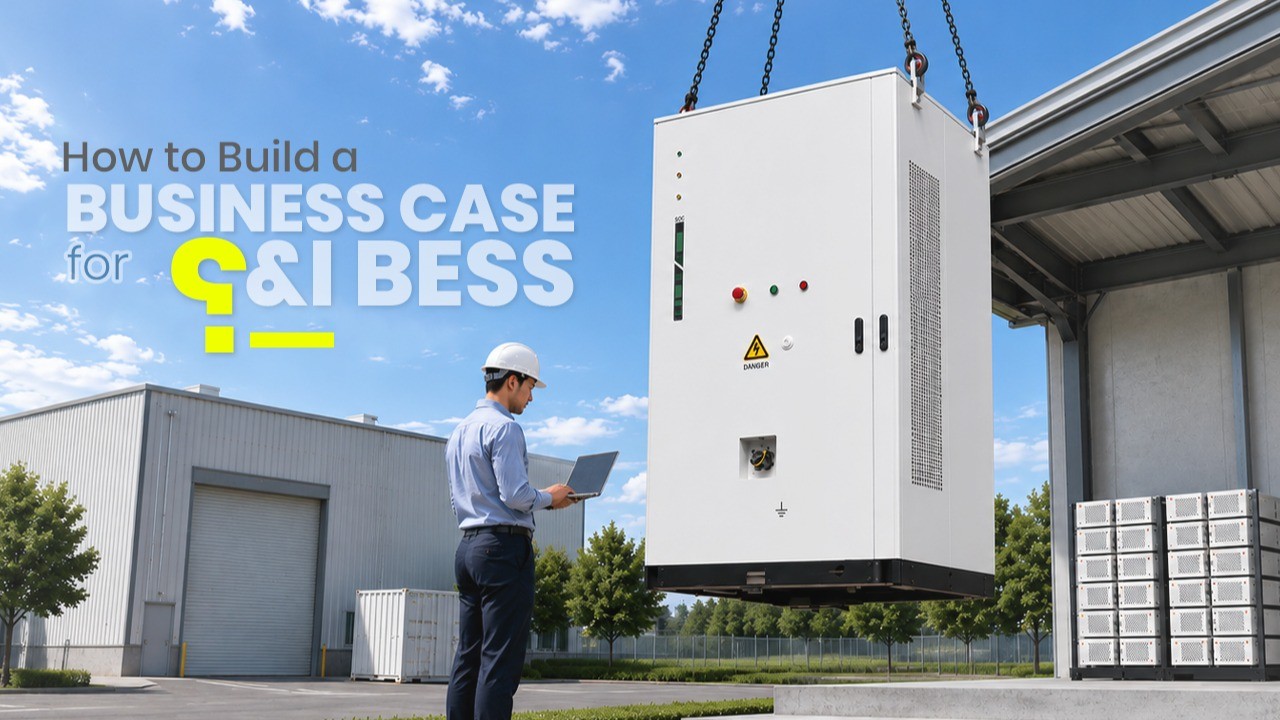
Why C&I BESS Deserves a Rigorous Business Case
Commercial and Industrial (C&I) Battery Energy Storage Systems have moved from experimental pilots to bankable infrastructure investments, but capital committees still demand disciplined financial justification before sign-off. A well-built business case translates technical capability — peak shaving, energy arbitrage, backup power, and solar integration — into a single, defensible investment narrative with quantified cash flows, risk-adjusted returns, and a clear implementation roadmap. In India, this exercise is increasingly favorable: competitive BESS bids have fallen from ₹10.18/kWh in 2022–23 to roughly ₹2.8/kWh in 2025–26, and behind-the-meter C&I installations crossed 1.2 GWh cumulative capacity by April 2026, making the segment the fastest-growing storage application in the country.

This article lays out a structured, section-by-section methodology for constructing a C&I BESS business case — covering the strategic rationale, load and tariff analysis, revenue-stacking economics, capex/opex modeling, financing and incentive structuring, risk assessment, and the governance framework needed to secure internal approval.
Step 1: Establish the Strategic Case
Every capital business case begins with a strategic rationale that answers “why now” before it answers “what returns.” For C&I facilities, this typically centers on three drivers: rising and volatile grid tariffs, unreliable grid supply requiring diesel backup, and corporate sustainability or RE100-linked commitments. Standard capital business case frameworks require an explicit comparison of “do nothing,” “do minimum,” and “do something” options, with net costs and risk exposure quantified for each so the recommended option — deploying BESS — is defensible against inertia.

For Indian industrial and commercial users specifically, the strategic case is strengthened by two structural realities: retail peak tariffs of ₹7–12/kWh in most states, and the true all-in cost of diesel backup power — including fuel, AMC, and switchover losses — reaching ₹31–35/kWh, compared with roughly ₹7–9/kWh for grid-charged battery power. Any facility running a 125 kW+ DG set is generally already in positive cash-flow territory from month one of BESS operation on backup-substitution economics alone.
Step 2: Conduct Load and Tariff Analysis
The single most important input to a credible business case is 12–24 months of 15-minute interval load data pulled directly from the facility’s energy meters, paired with the utility tariff sheet detailing demand charges, time-of-day (ToD) or time-of-use (TOU) rates, and any ratchet clauses that lock in peak charges across the year. This data reveals three critical parameters: peak duration (a 15-minute spike needs far less storage than a 2-hour plateau), peak frequency (daily, weekly, or seasonal), and the magnitude of the peak-to-off-peak tariff spread.

Analysts should identify the facility’s top 10 annual demand peaks, note each peak’s duration, and check whether spikes are coincident with grid-wide peaks (which typically carry the highest and least flexible charges). A peak-to-off-peak spread of at least ₹5/kWh, as seen in real Indian ToD tariff structures, is generally the threshold at which arbitrage cycling becomes economically compelling.
Step 3: Size the System Correctly
System sizing should be driven by the load analysis rather than an arbitrary MWh target. A standard sizing formula for backup applications is:
BESS capacity (kWh)= Critical Load (kW) × Backup Hours / Round-Trip Efficiency × Depth of Discharge

For example, an 80-kW critical load requiring 6 hours of backup, at 94% round-trip efficiency and 85% depth of discharge, requires approximately 603 kWh, rounded up to a 600-kWh system. For demand-charge and arbitrage applications, capacity should be matched to the longest recurring peak duration plus a 10–15% buffer for battery degradation over the warranty period. Oversizing erodes returns through unnecessary capex, while undersizing fails to eliminate the demand spikes that anchor the savings case — so this step should be validated against the interval data from Step 2, not against generic rules of thumb.
Step 4: Model the Revenue and Savings Stack
C&I BESS economics improve materially when multiple value streams are “stacked” onto a single hardware asset rather than relying on one application alone. The primary levers are:
- Demand charge reduction (peak shaving): Discharging during load peaks to flatten the billing-period maximum, typically cutting demand charges by 20–40%, since these charges can represent 30–70% of a C&I utility bill.
- Energy arbitrage (ToD/TOU): Charging during low-tariff windows and discharging during high-tariff windows; profitability is capped by the local peak-valley spread and round-trip efficiency.
- Diesel backup displacement: Replacing or supplementing DG sets, particularly valuable for facilities with 3+ hours of daily outage, where payback from avoided diesel costs alone can fall to 2–4 years.
- Solar self-consumption / absorption: Storing midday solar generation for evening use, maximizing the value of existing rooftop or captive solar assets.
- Grid services / demand response: Where available, earning revenue for standby capacity or frequency support, though this is more developed in mature markets than in India currently.

Global data illustrates the payoff from stacking: a 1 MW/4 MWh U.S. system combining demand charge savings, arbitrage, and frequency-regulation revenue achieved a 3.8-year payback and roughly 24% IRR, versus 6–8 years for demand-charge-only deployments in weaker tariff territories. In India, a representative 5 MWh installation at a textile facility with a ₹5/kWh ToD spread and ₹450/kVA demand charge required roughly ₹15 crore in capex against ₹3.2 crore in annual savings, yielding a 4.7-year simple payback.
Step 5: Build the Capex and Opex Estimate
The capex line should itemize battery modules and cells, the power conversion system (PCS), enclosures and thermal management, the battery management system (BMS), site electrical works and grid interconnection, and installation and commissioning labor. Opex includes routine maintenance, software/EMS licensing and updates, monitoring and remote diagnostics, and insurance. For India, the Union Budget 2026–27 has meaningfully improved the capex picture by introducing customs duty exemptions on lithium-ion cells, BESS capital goods, and battery equipment, which should be explicitly credited in the cost model rather than left as a contingency buffer.

Analysts should also budget for realistic capital cost benchmarks: fully installed C&I system costs in mature markets run roughly $550–650/kWh for smaller liquid-cooled systems, translating into a levelized cost benefit of around ₹2.1/kWh stored in the Indian textile-sector example above. A three-to-five vendor RFQ process is recommended to benchmark installed cost, warranty terms (10–15 year system life is typical for LFP chemistry), and EMS performance guarantees before finalizing the capex figure.
Step 6: Layer in Financial Metrics — Payback, IRR, and NPV
The core financial outputs a business case must present are simple payback period, Internal Rate of Return (IRR), and Net Present Value (NPV) over the system’s operating life, typically 10–15 years for LFP chemistry. Industry-wide benchmarks for well-designed C&I BESS show IRRs in the 12–25% range and simple paybacks of 3–8 years depending on rate structure and revenue stacking, with 20-year NPV multiples of 2–4x the initial investment achievable in favorable markets.

These figures should be treated as calibration benchmarks, not substitutes for facility-specific modeling — the actual numbers must flow from the load, tariff, and capex data gathered in Steps 2–5.
Step 7: Incorporate India-Specific Incentives and Policy Support
The financial case for Indian C&I BESS is meaningfully strengthened by an expanding national policy stack that should be explicitly modeled into the business case rather than treated as a footnote. The Union Cabinet approved a Viability Gap Funding (VGF) scheme covering up to 40% of capital cost for BESS projects, with an initial outlay of ₹9,400 crore targeting 4,000 MWh of capacity by 2030–31. A subsequent 2025 tranche expanded VGF to support 30 GWh of standalone BESS across 15 states, reducing the funding rate to ₹18 lakh/MWh — reflecting falling battery costs — while front-loading 70% of disbursement by Commercial Operation Date to improve early-stage cash flow and bankability.

The 2026–27 Union Budget scaled VGF allocation to ₹1,000 crore, alongside customs duty exemptions on lithium-ion cells and BESS capital goods, and formal recognition of storage as core grid infrastructure. Additional structural tailwinds include Energy Storage Obligations mandating DISCOMs to progressively procure storage-backed power (rising from 1% in FY2024–25 to 4% by FY2029–30, with Rajasthan already requiring 3% by FY2026–27), and transmission charge waivers for BESS co-located with renewables and commissioned by June 2028. While VGF primarily targets grid-scale and standalone projects rather than pure behind-the-meter C&I installations, business cases should still track state-level waivers on electricity duty, cross-subsidy surcharges, and stamp duty on land for storage assets, which several states are encouraged to offer.

Step 8: Address Grid Compliance and Interconnection Requirements
A business case that omits regulatory and technical compliance risk is incomplete, since non-compliance can delay commissioning and invalidate projected cash flows. Indian BESS installations must comply with the Central Electricity Authority’s (CEA) Technical Standards for Connectivity, the CEA Grid Standards Regulations 2010, the Indian Electricity Grid Code (IEGC) 2023, and applicable State Electricity Grid Codes. Systems must also meet fault ride-through requirements — remaining connected and supporting the grid during voltage dips to approximately 0.2 per-unit for up to 0.625 seconds — along with frequency response, reactive power support, and power quality standards covering harmonics, flicker, and voltage variation.

Battery safety compliance now includes the CEA (Measures Relating to Safety and Electric Supply) Amendment Regulations 2026, and system-level certification typically follows UL9540 or the equivalent IEC 62933-5-1/5-2 standards, alongside IEC 62485-2 for secondary battery safety and IEC 62909-1 for bidirectional grid-connected power converters. Building an interconnection and compliance timeline into the project schedule — including utility coordination and approval lead times — is essential, since these steps directly affect the commissioning date used to calculate payback.
Step 9: Structure the Financing and Delivery Model
Beyond outright capital purchase, business cases should evaluate alternative delivery structures such as Energy Storage-as-a-Service (ESaaS), where a third party owns and operates the asset in exchange for a shared-savings or subscription fee, shifting capex risk off the facility’s balance sheet. Financing structure materially affects the headline return: analysts should model direct purchase against lease or ESaaS options, incorporating the facility’s tax position and depreciation treatment where applicable, since accelerated depreciation and incentive stacking can compress payback by one to two years relative to unlevered purchase economics observed in comparable markets.

Step 10: Quantify and Mitigate Key Risks
A credible business case explicitly names its risks rather than presenting a single deterministic forecast. The most material risks for C&I BESS include battery degradation reducing usable capacity and cycling revenue over the asset’s life, tariff and regulatory changes altering the ToD spread or demand charge structure the savings case depends on, interconnection and permitting delays pushing back the commissioning date, and underutilization if the EMS fails to capture the full available revenue stack through inaccurate load forecasting. Sensitivity analysis — testing payback and IRR under conservative, base, and optimistic assumptions for tariff spread, cycling frequency, and capex — should accompany the base-case numbers, and warranty and performance-guarantee terms from the vendor RFQ (Step 5) should be cited as the primary mitigant against degradation risk.

Step 11: Assemble the Business Case Document and Governance Case
Capital investment frameworks typically require a business case to combine four components: a strategic case (the “why,” from Step 1), an economic case (the quantified costs and benefits from Steps 2–6), a commercial and financial case (the financing structure, incentives, and funding source from Steps 5, 7, and 9), and a management case (the delivery plan, governance, and risk mitigation from Steps 8 and 10). The final document should present the recommended system size and configuration, total installed cost net of applicable incentives, projected annual savings by revenue stream, payback period and IRR under base and sensitivity scenarios, a compliance and commissioning timeline, and a clear statement of key risks with mitigations — giving decision-makers everything needed to approve, defer, or reject the investment in a single review.

No responses yet